01
Measure the whole site
Meter makeup water, blowdown, and major cooling loops. Calculate annual WUE using the same boundary each year. National averages cannot show where water is going inside a specific facility.
Data center water consumption
U.S. data centers directly consumed 17.4 billion gallons of water in 2023. Water use at any one facility can vary widely. Cooling design, climate, load, and measurement boundaries explain why.
17.4B gal
Direct U.S. data center water consumption in 2023
0.36 L/kWh
Estimated average U.S. site WUE in 2023
120M gal
Annual use in one EPRI 150 MW hyperscale scenario
National and facility figures: EPRI, citing the 2024 LBNL U.S. Data Center Energy Usage Report.
The short answer
Data center water consumption can range from hundreds of thousands to millions of gallons per day at large facilities, depending on IT load, utilization, climate, cooling design, and Water Usage Effectiveness. EPRI estimates about 340,000 gallons per day for one 150 MW hyperscale scenario and about 2.7 million gallons per day for a water-cooled chiller scenario at the same load.
Annual averages should not size peak water infrastructure. Estimate data center peak water demand from the expected IT load, operating hours, utilization, local conditions, cooling architecture, and a documented site WUE assumption. A 2025 LBNL review found more than 10,000-fold variation in water use per workload across operating conditions.
For an operating site with evaporative cooling, the next question is how much cooling tower water leaves as liquid blowdown and could be recovered.
For operators, ask:
Measurement boundaries
The 17.4 billion gallon national figure refers to direct U.S. data center water consumption in 2023. It does not include water associated with electricity generation. Indirect use matters, but it should be reported separately because the result changes with the power mix and study boundary.
| Measure | What it includes | Why it matters |
|---|---|---|
| Direct water use | Water used on site for cooling, humidification, and facility operations. | The operator can measure and directly influence it at the facility. |
| Indirect water use | Water consumed in generating the electricity used by the data center. | It changes with the regional grid, power contracts, and accounting method. |
| Withdrawal | Water taken from a utility, surface source, groundwater source, or recycled supply. | It affects local supply and infrastructure even when some water is later discharged. |
| Consumption | Water not returned to the immediate water system, primarily through evaporation. | It measures water removed from immediate local availability. |
| Discharge | Water returned to a utility or the environment after use. | Its quantity and chemistry affect sewer cost and treatment requirements. |
The operator metric
Water Usage Effectiveness measures annual site water use relative to IT energy. A lower number means less site water is used for each unit of IT energy.
WUE formula
Annual site water use in litersAnnual IT equipment energy in kWh
EPRI reports site WUE values ranging from 0.1 to 9.0 L/kWh. It estimates an average of 0.36 L/kWh for U.S. data centers in 2023, increasing to 0.45 to 0.48 L/kWh by 2028.
WUE is useful only when the boundary and time period are consistent. Compare annual values, document whether recycled water is included, and evaluate WUE with Power Usage Effectiveness. A cooling strategy can reduce water while increasing electricity, or improve energy efficiency while increasing evaporation.
Definition: U.S. Department of Energy. Range and estimates: EPRI.
Estimate peak demand for your site
Annual averages do not size peak water infrastructure. Estimate a design day using the expected IT load, utilization, cooling architecture, local conditions, and a documented WUE assumption. Data center water consumption per megawatt is not a universal constant because each of those inputs changes the result. The U.S. Department of Energy defines WUE as site water use divided by IT equipment energy and notes that cooling water consumption is tied to IT heat load and cooling-system efficiency.
Design-day framework
IT load in kW × operating hours × expected utilization × site WUE in L/kWh
This planning calculation adapts DOE's annual WUE equation to a defined design-day period. Convert liters to gallons only after the load, time period, utilization, and WUE boundary are fixed.
Use measured site values where possible. For a planning range, test more than one load and WUE scenario, then review makeup capacity, discharge limits, water cost, and resilience together.
Sources: EPRI, Water Usage in Data Centers for WUE ranges and 150 MW facility scenarios; U.S. Department of Energy for the WUE equation and cooling-water drivers; and LBNL Data Center Water Efficiency for site measurement and monitoring guidance.
Check recovery relevanceWhere the water goes
01
Server heat moves through air handling or liquid loops to chilled water and a condenser water loop.
02
The cooling tower evaporates part of the circulating water to reject heat efficiently.
03
The remaining water becomes more mineral-concentrated, so a portion is discharged to protect system chemistry.
Evaporation and blowdown are different water streams. RECOVER targets liquid blowdown, not water already lost to the atmosphere. Process source: U.S. Department of Energy.
Operator actions
01
Meter makeup water, blowdown, and major cooling loops. Calculate annual WUE using the same boundary each year. National averages cannot show where water is going inside a specific facility.
02
Better server utilization, equipment efficiency, airflow management, and facility efficiency reduce both electricity demand and the cooling load behind it.
03
Air-side economization, dry cooling, and hybrid systems can reduce water use where ambient conditions and equipment temperatures allow. Compare water, PUE, capital cost, footprint, and resilience together.
04
Reclaimed or recycled water can reduce reliance on potable supply. Availability, treatment needs, infrastructure, and local competition determine whether it is practical at a specific site.
05
Where evaporative cooling remains the best operating choice, continuous demineralization can return blowdown to the loop while keeping dissolved minerals within operating limits.
Operator guidance: DOE, EPRI, and the LBNL Center of Expertise.
Choose the question your site needs to answer before modeling recoverable blowdown.
From research to site evaluation
National averages cannot show what a specific site can recover. If the facility uses cooling towers and discharges blowdown, use the site's cooling load, water rates, and operating assumptions to model the opportunity, or review how RECOVER treats the stream.
Recover, do not dump
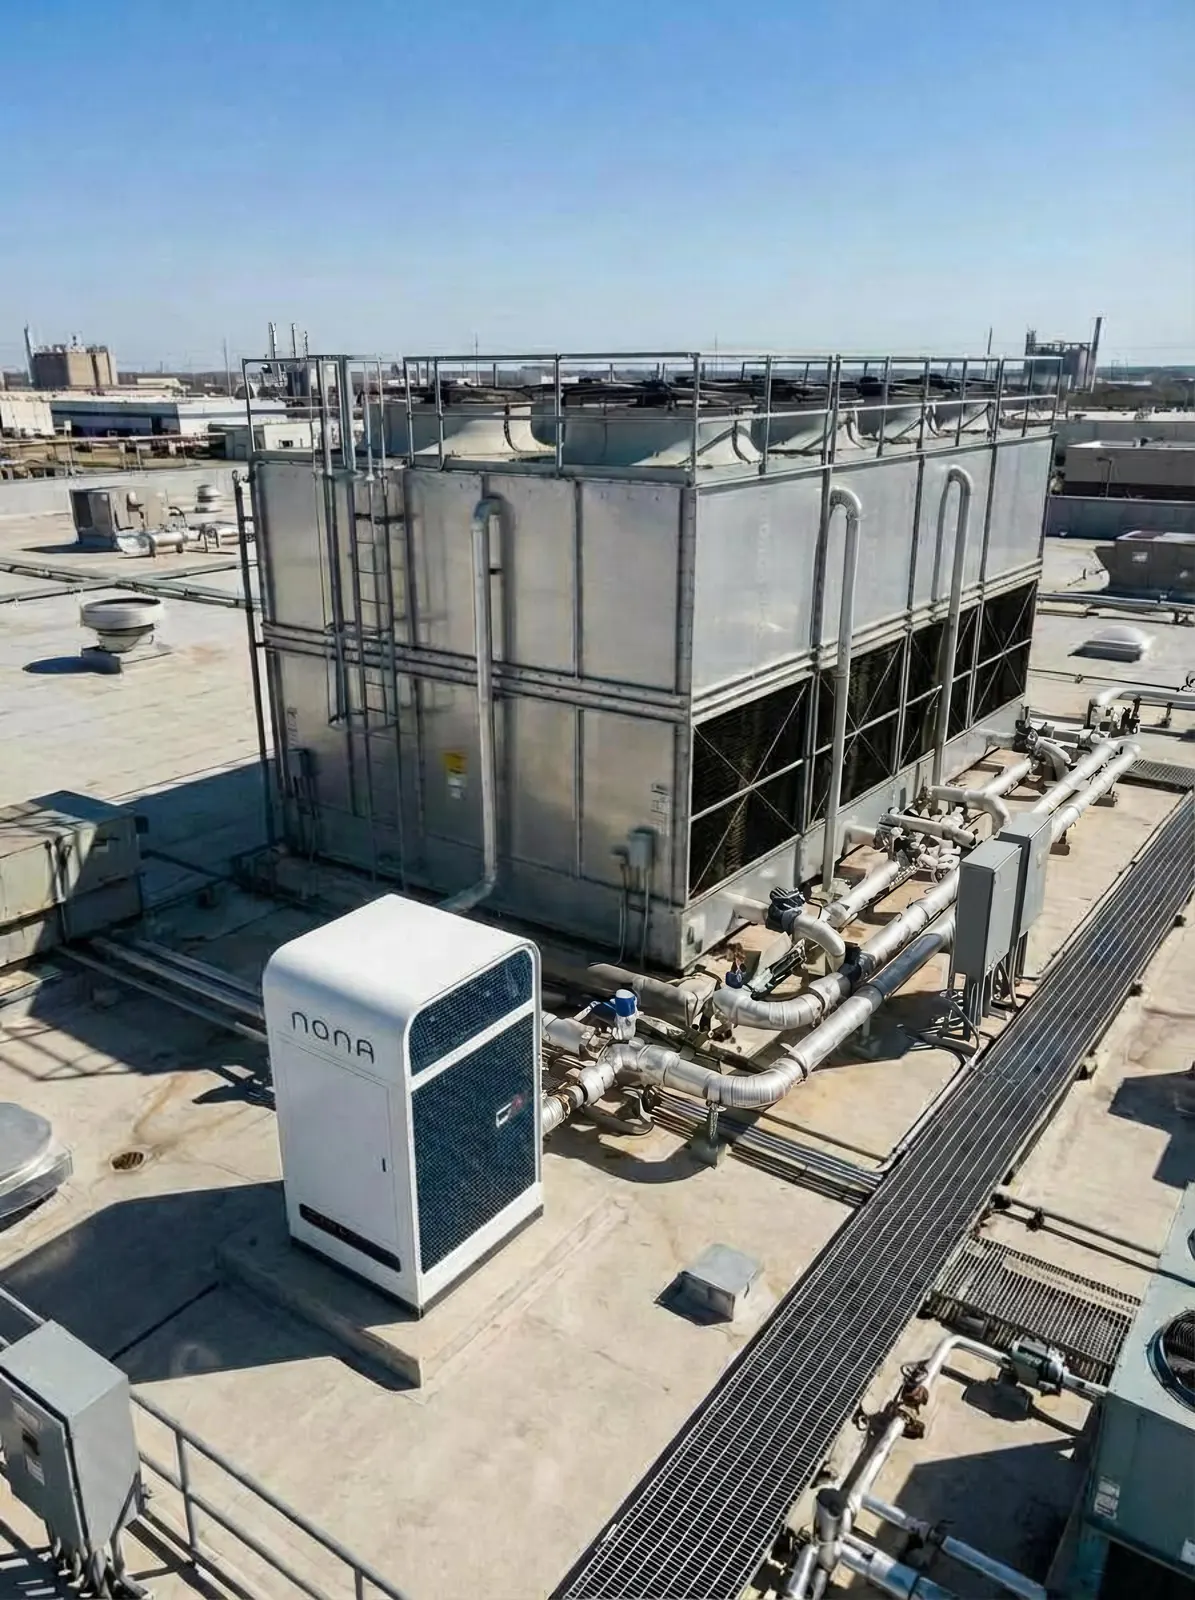
NONA RECOVER uses Ion Concentration Polarization (ICP), an MIT-patented alternative to reverse osmosis, to continuously demineralize cooling water and recover 90% of cooling tower blowdown on site. Here, ICP does not mean Inductively Coupled Plasma, the unrelated laboratory analysis technique. RECOVER works alongside the cooling towers already on site.
Evaluation sequence
Direct answers to the questions operators ask when comparing cooling water strategies.
There is no reliable universal average. EPRI estimates about 340,000 gallons per day for one 150 MW hyperscale scenario and about 2.7 million gallons per day for a water-cooled chiller scenario at the same load. Climate, utilization, cooling design, and WUE can change the result substantially.
Some do, but the answer depends on facility load, climate, cooling design, utilization, and whether the measurement includes only on-site consumption or indirect water used to generate electricity. Operators should compare annual Water Usage Effectiveness, peak demand, discharge, and energy together.
No. Cooling approaches vary by climate, facility design, and IT equipment. Some sites can use outside air or dry heat rejection for much of the year. Others use evaporative cooling because it can reject heat efficiently with less fan energy and footprint. Operators should compare water and electricity together.
A lower WUE indicates less site water use per kWh of IT energy, but there is no universal target for every climate and cooling architecture. EPRI reports a broad range of 0.1 to 9.0 L/kWh and an estimated U.S. average of 0.36 L/kWh in 2023. The useful benchmark is a consistent annual site measurement paired with PUE and operating context.
Evaporation is water converted to vapor as a cooling tower rejects heat. Blowdown is liquid water intentionally discharged to keep dissolved minerals from concentrating beyond operating limits. RECOVER targets blowdown, not water already lost through evaporation.
Operators can meter the cooling system, improve efficiency, optimize controls and cycles of concentration, use alternative water where practical, and recover blowdown. The right mix depends on site climate, water chemistry, load, infrastructure, and resilience goals.
Source library
Lawrence Berkeley National Laboratory
2024 United States Data Center Energy Usage ReportElectric Power Research Institute
Water Usage in Data CentersU.S. Department of Energy
Cooling Water Efficiency Opportunities for Federal Data CentersLawrence Berkeley National Laboratory
The water use of data center workloadsLBNL Center of Expertise for Data Center Efficiency
Water EfficiencyEnter your cooling load, water rates, and operating assumptions to estimate potential RECOVER savings.